What is FTIR Spectroscopy?
FTIR stands for “Fourier transform infrared” and it is the most common form of infrared spectroscopy. All infrared spectroscopies act on the principle that when infrared (IR) radiation passes through a sample, some of the radiation is absorbed. The radiation that passes through the sample is recorded. Because different molecules with their different structures produce different spectra, the spectra can be used to identify and distinguish among molecules. In this way, the spectra are like people’s fingerprints or DNA: virtually unique.
FTIR is the preferred method of infrared spectroscopy for several reasons. First, it does not destroy the sample. Second, it is significantly faster than older techniques. Third, it is much more sensitive and precise.
These benefits of FTIR derive from the use of an interferometer, which is the infrared “source” and which allows for the greater speed, and the Fourier transform. The Fourier transform is a mathematical function that takes apart waves and returns the frequency of the wave based on time. The “output” of the interferometer is not the spectroscopy spectrum we use, but a graph known as an “interferogram.” The Fourier transform converts the interferogram into the infrared spectroscopy spectrum graph we recognize and use.
What is FTIR spectroscopy used for?
FTIR spectroscopy is used in organic synthesis, polymer science, petrochemical engineering, pharmaceutical industry and food analysis. In other words, it has a wide array of applications, from monitoring processes to identifying compounds to determining components in a mixture.
How does FTIR work?
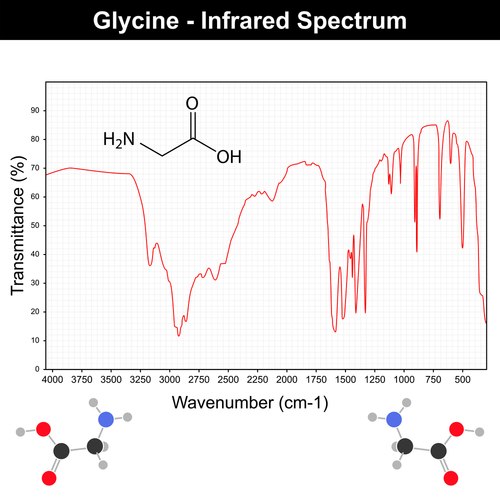
A molecule’s covalent bonds will selectively absorb radiation of specific wavelengths, which changes the vibrational energy in the bond. The type of vibration (stretching or bending) induced by the infrared radiation depends on the atoms in the bond. Because different bonds and functional groups absorb different frequencies, the transmittance pattern is different for different molecules. (Transmittance is the flipside of absorbance.) The spectrum is recorded on a graph with wavenumber (cm–1) recorded on the X-axis and transmittance recorded on the Y-axis. (Wavenumber is 1/wavelength and corresponds to the energy of the vibration of the molecular bonds.)
How to read an FTIR spectrum
Reading the spectrum is a matter of determining which groups and bonds correspond to which peaks. Simple reference tables for the various groups can help and full spectra can be located both on our product pages and on NIST.

An example of an IR Spectrum graph for Glycine.
To continue reading please sign in or create an account.
Don't Have An Account?