Detection of Endogenous Pathway Activity in Novel Reporter Cell Lines
Andrey Samsonov, Senior Scientist, Hongyi Zhang, Senior Scientist, Fan Zhang, Senior Scientist, Nathan Zenser, Senior Scientist, John Fetter, Associate Research Fellow, Dmitry Malkov, Principal Investigator
Biowire Spring
2012, 13–18
Biowire Spring 2012 — Live Cell Imaging of Signaling Pathways
Introduction
CompoZr® ZFN (zinc finger nuclease) technology was used to insert the sequence for fluorescent proteins adjacent to endogenous genes for signal transduction proteins to create novel reporter cell lines for compound screening. These cell lines include ones with fluorescent tags on EGFR, STAT1, and STAT3. Addition of growth factors to these cell lines activates translocation that can be monitored under live cell conditions.
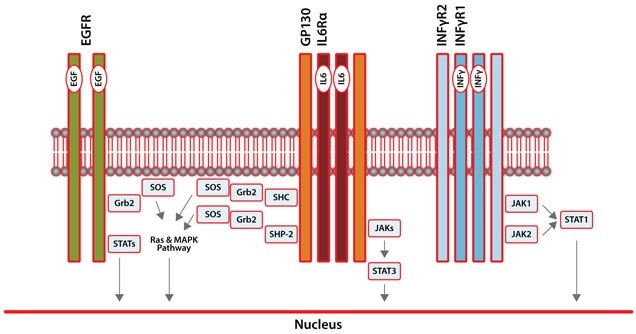
Receptor tyrosine kinases (RTKs) such as epidermal growth factor receptor (EGFR) are cell-surface growth factor receptors that dimerize and autophosphorylate upon ligand binding (Figure 1). They transduce signals across the cell membrane and thus regulate diverse cell functions1. Overexpression of EGFR has been found in various cancers. This has lead to the development of clinically approved therapeutics that target EGFR for colon, lung, breast, pancreas, and head and neck cancers2. Overexpression of EGFR, along with that of other kinases, can lead to constitutive activation of the oncogene STAT3 (Signal Transducer and Activator of Transcription 3). STAT3, a member of the STAT protein family (STAT1-7), is a signaling intermediate that mediates the action of many cytokines and growth factors (Figure 1)3. STAT3 is constitutively active in many different cancers including prostate, breast, lung, head and neck, colon, liver, and pancreas, as well as in multiple myeloma and large granular lymphocytic leukemia4. Numerous studies have repeatedly demonstrated inhibiting STAT3 results in decreased tumor growth and improved animal survival by inducing tumor cell apoptosis, inhibiting angiogenesis, and enhancing antitumor immune-mediated cytotoxicity. Another STAT family member, STAT1, possesses cancerinhibitory properties and, once activated, may promote apoptosis in tumor cells (Figure 1)3. Ideally, the potential inhibitors of STAT3 should be very selective and should not inactivate STAT1.

Figure 1.Signal Transduction Pathways for EGFR, IL6, and IFNγ. To monitor these three pathways, fluorescent proteins were used to tag EGFR, STAT1, and STAT3.
Utilizing our in-house CompoZr technology with the homologous recombination pathway induced by ZFNs, single-clone-derived EGFRFP, FP-STAT3, and FP-STAT1 cell lines were created in A549 and SKOV 3 cells (Figure 2). Having endogenous gene expression/regulation and preserved protein function for FP-tagged EGFR and STAT3 makes the cell lines valuable for high-content screening of compound libraries to find novel modulators of their activity.

Figure 2. Schematics of the Three Tagged Loci Showing ZFN Binding Sites/ZFN Cut Site with Respect to the Targeted Integration Site.The donor (top) has the homology arms of indicated length and the fluorescent protein (FP) sequence (green).
Materials and Methods
A549 and SKOV 3 cells (Cat. No. CCL-185 and HTB-77) cells were obtained from ATCC. The SKOV 3 cells were cultured according to the product manual and A549 were grown in RPMI-1640, 2 mM glutamine, 10% FBS in 5% CO2, 37 °C.
ZFN nucleofections were performed with the Amaxa® Nucleofector® device (Cat. No. AAD-1001) and Nucleofector® Kit T or Nucleofector® Kit V (Cat. No. VCA-1002 or Cat. No. VCA-1003) from Lonza AG according to the product manual. Donor plasmids were designed and constructed in-house.
Fluorescent reporter genes were obtained from Evrogen (evrogen.com/products/TagFPs.shtml). CompoZr ZFNs were designed and manufactured by our scientists in our facilities as well as all reagents and materials used in this work, unless otherwise indicated.
Fluorescent imaging of cells was done with a Nikon Eclipse TE2000-E inverted research microscope and MetaMorph® software using a 40x/1.3 oil objective. Cells were imaged live in Hanks’ balanced salt solution (Cat. No. H8264) supplemented with 2% fetal bovine serum (Cat. No. F2442). Filter sets were GFP (excitation 450–490 nm/emission 500–550 nm) and RFP/TRITC (excitation 530–560 nm/ emission 590–650 nm).
For STAT1 immunolabeling, A549 cells were fixed with 3.7% formaldehyde and permeabilized with 0.1% Triton® X-100 before or 30 minutes after addition of 100 ng/mL IFN-γ. Anti-STAT1(isoform α) rabbit primary antibody (Cat. No. SAB4300441) was used at 1:50 dilution and TRITC-labeled goat anti-rabbit IgG (Cat. No. T6778) was used at 1:500 dilution.
Discussion
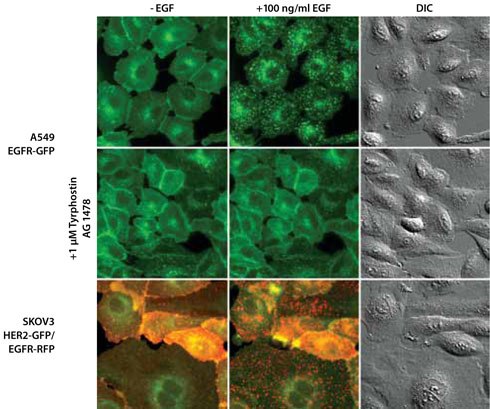
Fluorescence detection of proteins traditionally relied on either exogenous promoters or immuno-techniques requiring cell fixation. With ZFN technology, it is now possible to create stable integration of a reporter gene into the genome. Unlike fusion proteins generated with an external promoter, the fusion proteins created using the ZFNs are expressed at their physiological level and thus are more likely to retain the characteristic expression profile of the endogenous proteins in the cell. In contrast to biochemical assays or immunostaining, using a tagged protein under endogenous regulation avoids fixation artifacts and allows detection of the activity in live cells. This work demonstrates successful tagging of three loci that code for important pathway targets: EGFR, STAT1, and STAT3. In wild-type cells, activation of EGFR leads to receptor internalization5. Having a fluorescent tag on the EGFR allows tracking of this normal internalization process after the addition of EGF to the cells (Figure 3, top row). The EGFR kinase inhibitor Tyrphostin AG 1478 blocked the receptor internalization process (Figure 3, middle row).

Figure 3. Fluorescence Microscopy and Differential Interference Contrast (DIC) Images of Isolated Single-Cell Clones Expressing the EGFR Gene (Epidermal Growth Factor Receptor, Also Known as ErbB1) Endogenously Tagged with GFP (A549 Lung Carcinoma) or RFP (SKOV3 Ovarian Adenocarcinoma) at the C-Terminus.
The SKOV 3 line also has the second gene HER2 (Human Epidermal growth factor Receptor 2, also known as ErbB2) endogenously tagged with GFP at the C-terminus. The EGF images were taken 20 (A549 EGFR-GFP) or 10 (SKOV 3 HER2-GFP/EGFRRFP) minutes after addition of 100 ng/mL EGF). Preincubation with 1 mM Tyrphostin AG 1478, a selective EGFR inhibitor, for 20 minutes prior to the addition of EGF blocks the internalization of the fusion protein (shown for A549 EGFR-GFP).
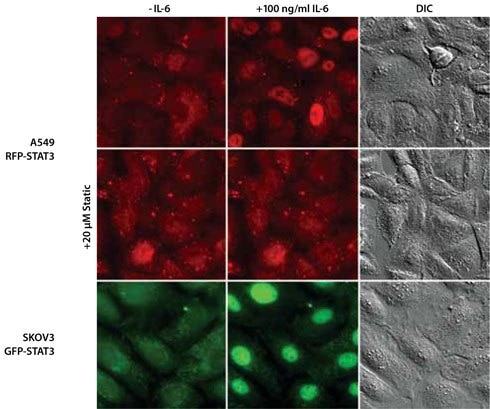
With ZFN-mediated gene tagging in knockin cell lines, STAT3’s native gene regulation is conserved, resulting in normal protein expression levels and preservation of protein function. Within 30–40 minutes of IL-6 treatment, the GFP- or RFP-tagged STAT3 was primarily localized in the nucleus of the A549 and SKOV 3 cells (Figure 4, top and bottom row). However, after preincubation of the cells with 20 mM Stattic for 1 hour, the IL-6-induced nuclear translocation of STAT3 was inhibited (Figure 4, middle row).

Figure 4. Fluorescence Microscopy and DIC Images of Isolated Single-Cell Clones Expressing the STAT3 Gene Endogenously Tagged with RFP (A549 Lung Carcinoma) or GFP (SKOV3 Ovarian Adenocarcinoma) at the N-Terminus.
The IL-6 images were taken 30 (A549 RFP-STAT3) or 20 (SKOV 3 GFP-STAT3) minutes after addition of 100 ng/mL IL-6. In cases where cells were preincubated for 1 hour with 20 mM Stattic, a specific STAT3 inhibitor, the IL-6 treatment did not induce STAT3 translocation (shown for A549 RFP-STAT3).
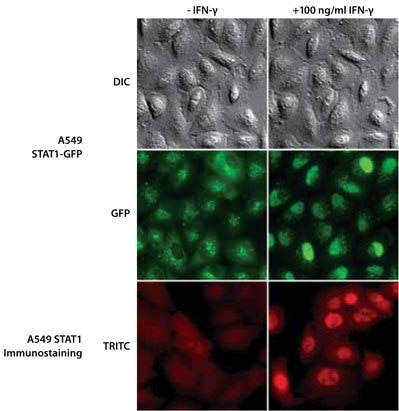
ZFN-mediated gene tagging of endogenous STAT1 allowed normal expression of the fluorescently tagged protein (Figure 5, middle row). STAT1-GFP expression occurs throughout the cell. The punctate labeling is from autofluorescence of endosomes that can be seen even with the wild-type cell line. Within 25 minutes after addition of IFNγ, the STAT1-GFP was primarily localized to the nucleus (Figure 5, middle row). Immunostaining of wild-type cells showed a similar effect — i.e, that addition of IFNγ caused the STAT1 to concentrate in the nucleus (Figure 5, bottom row). Thus the GFP-tagged cell line shows the same function as the wild-type cell line without the requirement for fixation and immunostaining.

Figure 5. Fluorescence Microscopy and DIC Images of Isolated Single-Cell Clones Expressing the STAT1 Gene Endogenously Tagged with GFP (A549 Lung Carcinoma) at the C-Terminus Compared to Immunofluorescence Analyses for STAT1 in A549 Cells. The IFN-γ images were taken 25 minutes after addition of 100 ng/mL IFN-γ.
Other tagged cell lines have also been created, including tagged organelle markers and ones that allow monitoring of cell signaling intermediate translocation (Table 1). These cell lines should be useful for live-cell screening assays to find compounds that affect cell structure or signaling pathways.
References
To continue reading please sign in or create an account.
Don't Have An Account?