Monitoring Method Reproducibility with Belysa™ Immunoassay Curve Fitting Software
Immunoassay users are often well aware of the potential for variability to influence the outcome of their experiments. At the individual plate level, between assays and between lots of assays, there are numerous considerations when looking to evaluate the method that is being applied to a study. An excellent paper by Khan et al in 2015 described many of these and strategies that can be used to evaluate them.1 A key challenge for many scientists is the ability to see variability within their method. An individual plate may be easy to evaluate for replicate coefficient of variation percentage (%CV) or parameters such as the expected recovery of the assay. However, as the volume of assays run increases, or even just the volume of data increases if you are performing multiplex experiments, it can become repetitive and laborious to perform the appropriate checks. As projects extend to the point where multiple lots of the same kit are required, it is important to be aware of any lot-to-lot differences, normally done by comparing standard curves. To this end, we have designed the Belysa™ Immunoassay Curve Fitting Software, a tool that allows you to easily monitor your method and ensure it is reproducible over time.
In this article we will demonstrate how this software can be used:
- At the single assay level
- Over multiple plates
- Over multiple lots
The files applicable to this software are from ELISA readers as well as Luminex® and SMCxPRO™ instruments.
What Is Belysa™ Immunoassay Curve Fitting Software?
Belysa™ Immunoassay Curve Fitting Software is a user-friendly tool that allows you to compare calibration curves and optimize your data. With the Belysa™ software, bench researchers gain the ability to easily and affordably evaluate method reproducibility and consistency between immunoassays plate to plate and over the course of longitudinal studies. That means you can not only see the same consistent performance that we test for in our products, but also that you have the ability to flag and avoid assay drift and manual errors instead of attempting to normalize them after the fact.
Discover how to gain more insights into your immunoassay methods in the Belysa™ Application Note.
Evaluating a Single Plate
The Belysa™ software allows the user to quickly evaluate a single plate of an immunoassay in a number of ways. Firstly, the software will show the distribution of the samples against the standard curve and plot the lower limit of quantitation (LLOQ) (Figure 1). This will be done for all biomarkers within an acquisition file. From this, we can immediately tell that the assay had a suitable dynamic range for the samples tested. Further, the screen contains an optimization wizard which will select the optimal curve to fit the standard points as provided metrics, such as the curve equation and limit of detection (LOD) of the assay.
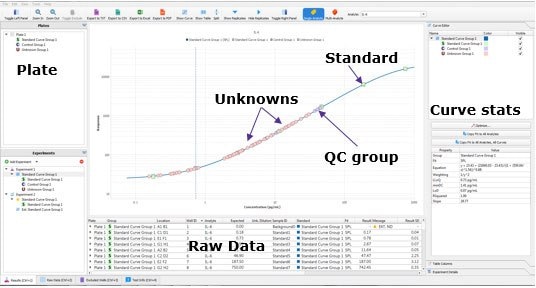
Figure 1.Belysa™ Immunoassay Curve Fitting Software demonstrating the samples distributed on the standard curve and the position of the LLOQ (QC = quality control).
The user can then move to the “raw data” tab where they are confronted with a wall of data. Within this data, are the details such as the variance between sample replicates or the expected recovery of the standard curve points. In the software, the user can set the Replicate %CV or % Recovery they accept, and flags will be applied against any data point that is outside the criteria (Figure 2). By using this tool, a scientist can quickly ensure that the standard curve and samples performed in a fashion that can be reproduced by another scientist.
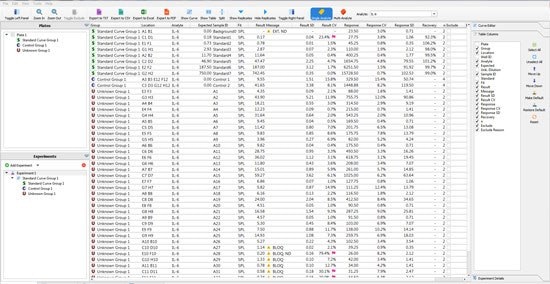
Figure 2.The wall of numbers presented by a single 96 well immunoassay. The Belysa™ tool assigns flags according to the lab’s specifications.
Over Multiple Plates From a Single Lot
The multi-plate experiment from a single lot is a strategy used for both fresh samples and archived samples where kits from a single batch have been purchased. The advantage of this is that there will be no variability from assay lot, however the lab may experience inter-assay variance simply by having multiple people conducting the assays. Differences in technique such as pipetting or reagent preparation can affect the returned Optical Density (OD) of the standard curve.
It is important to compare the standard curves of each assay to ensure that the slopes of each plate’s standard curves are similar. If the slopes are similar, the samples should also report similarly. The Belysa™ software contains a mathematical parallelism tool that allows for the importation of standard curves. All of them will have a slope ratio calculated against the first curve added to the tool. A ratio of 1 indicates a set of perfectly parallel curves (Figure 3), although often it is not hard to spot a deviation by eye (Figure 4).
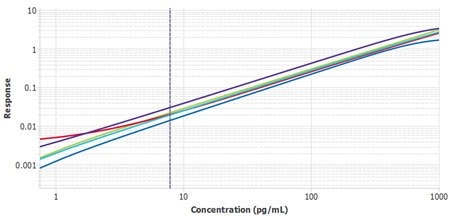
Figure 3.Six plates of monocyte chemoattractant protein-1 (MCP-1) ELISA (Cat. No. EZMCP1-98KRM) from three lots, run by two separate operators, with Plate 1 from Lot 1 used as the reference curve. A slope ratio of 1 indicates that the linear portions of the curve are mathematically parallel.
The process to import the tool is extremely short. Within a couple of minutes, a scientist can import all their curves and quickly determine that they or their team have faithfully executed their protocol multiple times.
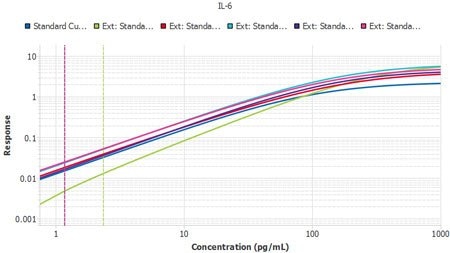
Figure 4.Six plates of interleukin-6 (IL-6) ELISA (Cat. No. EZIL6-98K) from three lots, run by two separate operators, with Plate 1 from Lot 1 used as the reference curve. A slope ratio of 1 indicates that the linear portions of the curve are mathematically parallel. P2 was identified as a user deviation, later confirmed by the user.
Over Multiple Lots
Perhaps the most frustrating and expensive form of variation is that between different lots of assays. Once a study enters its second year, the laboratory will likely need to purchase kits that are constructed from different lots of components. At this stage, a method is required to confirm the kits are performing similarly. One preferred strategy is to perform a sample bridge between the new lot and the prior lot to ensure the samples report similarly. The Belysa™ Parallelism Tool can aid and enhance this kind of process over the course of a longitudinal study. As each new lot of kits arrives, its curves can be imported
from previous batches so the slope ratios can be compared against a reference curve from the original batch to ensure consistent lot performance (Figure 5).
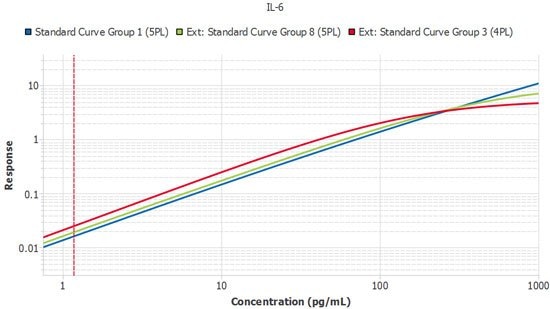
Figure 5.A single plate from three lots of IL-6 ELISA (Cat. No. EZIL6-98K) run by the same technician. Slope ratios were within the acceptance criteria of 1 +/- 0.1.
Summary of Monitoring Method Reproducibility
The Belysa™ software is a tool designed in concert with our Field Application Specialist teams. Each of the applications was proposed to enhance the capability of immunoassay users to evaluate their method for its consistency of application, starting with that of a single plate and working up to the evaluation of multiple kit lots over years of study. With an extremely user-friendly interface, these checks become rapid and easy to apply ensuring that any method deviations are caught early and therefore may potentially be ameliorated.
Discover more information about this software, including presentations, on our Belysa™ Landing Page.
If you wish to schedule a demonstration please contact your local salesperson or fill out our online contact form.
References
To continue reading please sign in or create an account.
Don't Have An Account?